The bait, then the rug-pull.
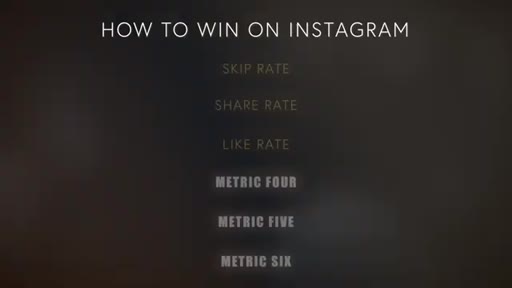
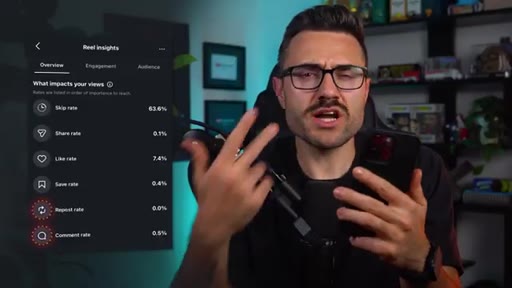
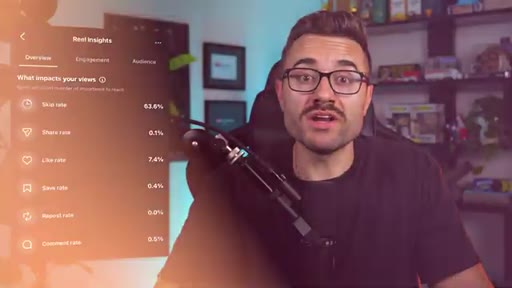
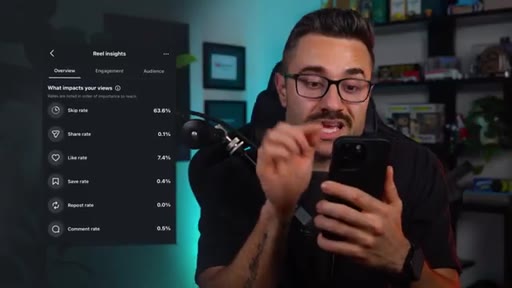
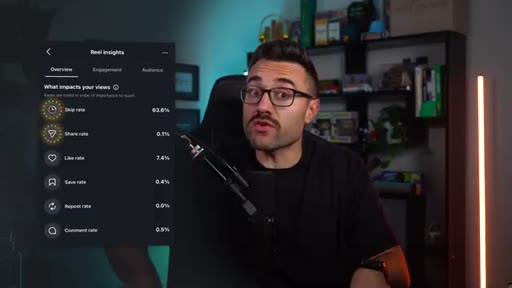
Instagram handed creators a roadmap and most of them are ignoring it. The platform updated Reels insights panel now shows six engagement metrics in the exact order it weights them -- a ranked list from the most critical signal to the least. Enrico Incarnati, who runs social for the third-largest podcast on the planet, spent 19 minutes turning that list into a content engineering system.
Where the time goes.
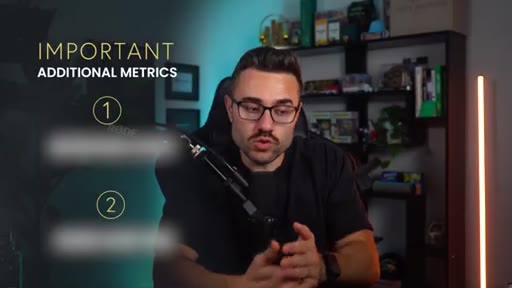
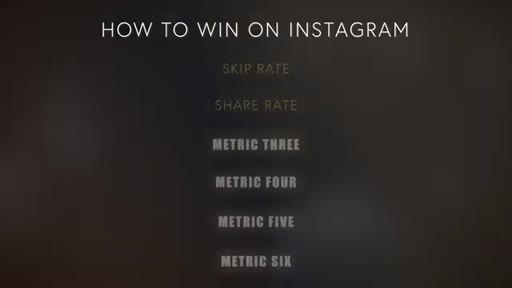
01 · The six metrics, ranked
Introduces the six metrics Instagram added to Reels insights and promises benchmarks plus engineering tactics for each.
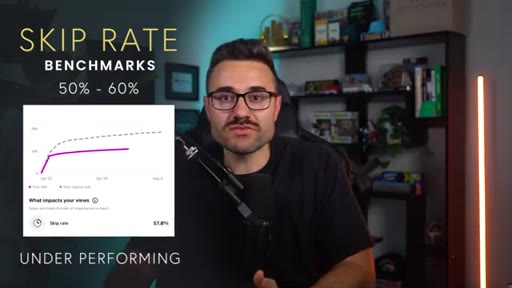
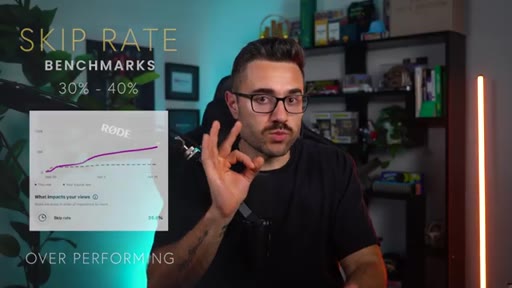
02 · Metric 1: Skip Rate
Skip rate is the percentage of viewers who scroll past in the first three seconds. Benchmarks: 50-60% underperforming, 30-40% elite, under 30% potential viral.
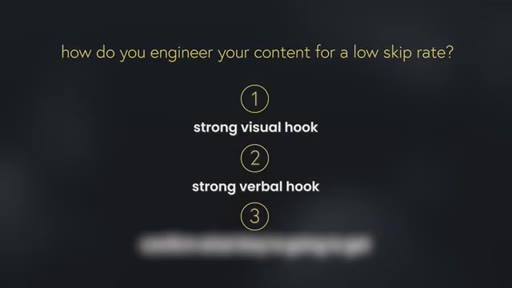
03 · Engineering a low skip rate
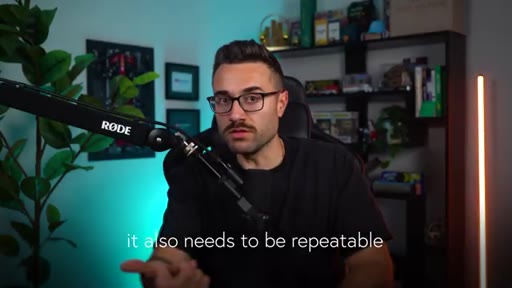
Three levers: strong visual hook, strong verbal hook with contrarian frame, and confirm what they will get -- all within the first three seconds.
04 · Metric 2: Share Rate
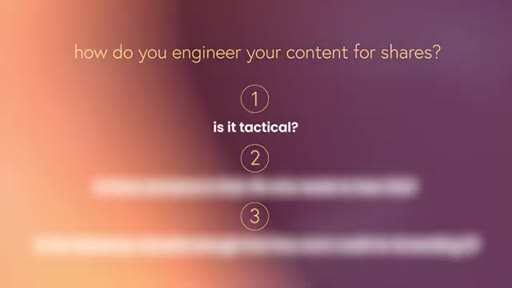
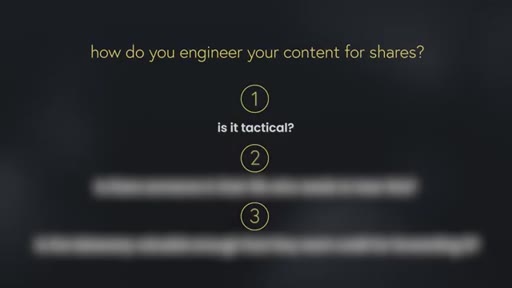
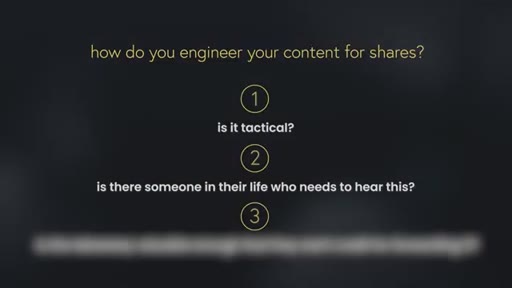
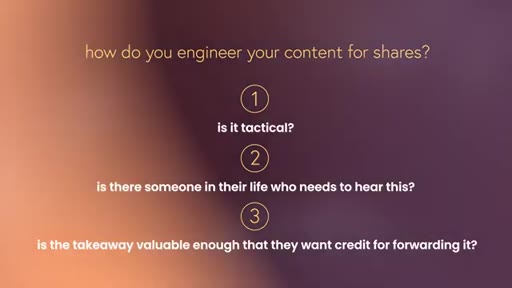
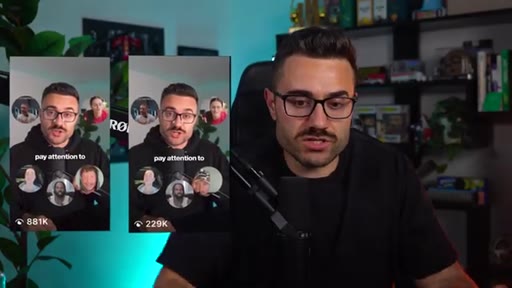
Share rate is sends per reach -- the strongest social proof a Reel can earn. Three-prong shareability test: tactical today, someone needs to hear this, viewer wants credit for forwarding it.
05 · Metric 3: Like Rate
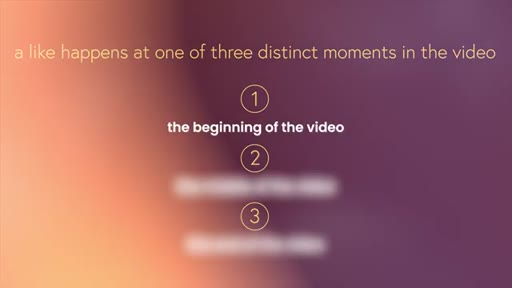
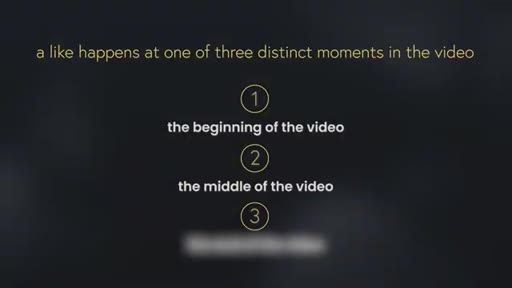
Likes happen at three distinct moments: beginning (superfan or hook confirmation), middle (non-follower trust proof), end (deepest trust signal, highest follower conversion). Design for all three.
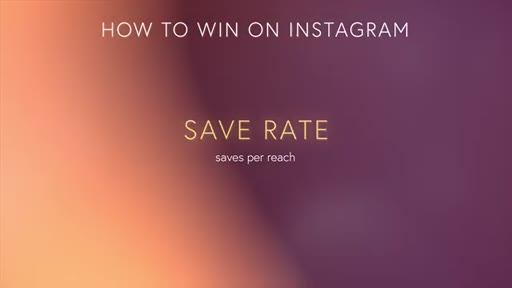
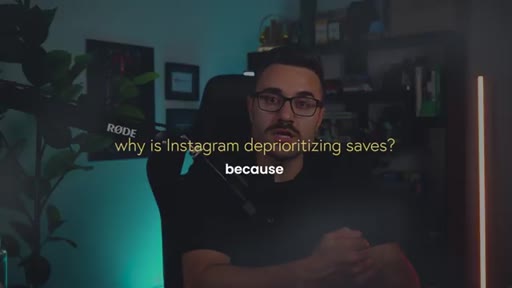
06 · Metric 4: Save Rate
Instagram deprioritizes saves because users almost never return to their saved folders. Still create save-worthy content but do not sacrifice skip or share rate to chase saves.
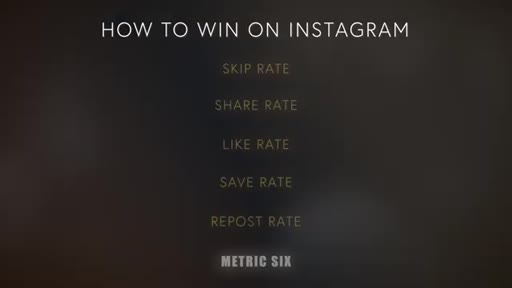
07 · Metric 5: Repost Rate
Reposts are a passive signal -- lower conviction than a share or collab. Nail share and like rate and reposts follow. Self-repost tactic: repost own content after 24 hours.
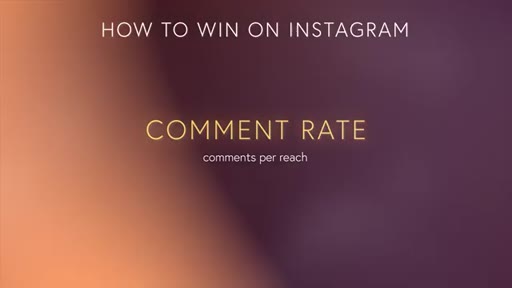
08 · Metric 6: Comment Rate
Dead last. Comment-farming bots signal off-platform intent, suppressing reach. Automations are fine for lead capture -- just do not engineer content around generating comments.
09 · Retention chart + Views over time
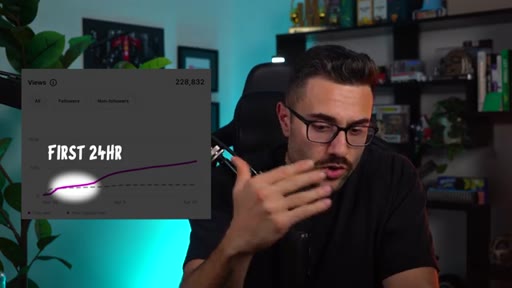
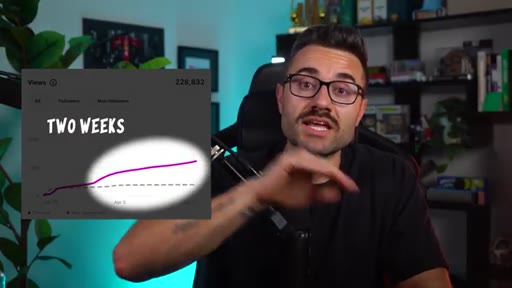
Retention target: avg view duration 20-30% of total length. Do not judge a Reel in the first 24 hours -- some take a week-plus to find their audience.
10 · Closing takeaway + CTA
Core message: stop getting emotional about your content, just read the data. CTA: 90-minute content audit offer.
Visual structure at a glance.

Named ideas worth stealing.
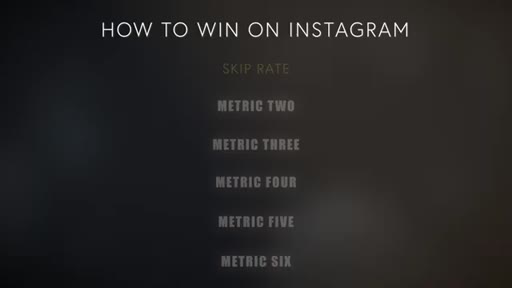
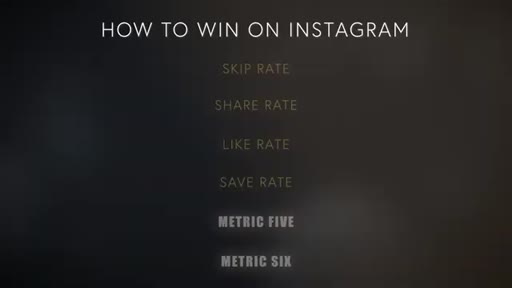
Instagram Six-Metric Ranked Priority List
- Skip Rate
- Share Rate
- Like Rate
- Save Rate
- Repost Rate
- Comment Rate
Instagram surfaces these six metrics in order of importance in the Reels insights panel. The order is the strategy.
Three-Prong Shareability Test
- Is it tactical and actionable today?
- Is there someone in their life who needs to hear this?
- Is the takeaway valuable enough that they want credit for forwarding it?
Run every Reel through this before publishing. Hit one = shares. Hit two = double share rate. Hit all three = shares explode.
Three Moments of the Like
- Beginning -- hook confirmation or superfan
- Middle -- non-follower trust proof
- End -- deepest trust signal, highest follower conversion
Likes cluster at three distinct points in a video, each signaling something different about viewer trust and intent.
Skip Rate Benchmarks
- 50-60%+ = underperforming (hook not landing)
- 30-40% = elite / overperforming
- Under 30% = potential viral
Concrete skip rate thresholds based on thousands of engineered Reels.
Lines you could clip.
"Skip rate is quite literally the gate. None of the other five matter if no one is watching past your first three seconds."
"Stop looking for an excuse as to why it did not work. The audience did not like your content."
"Every single second you are making in the video has one job. Earn the next second."
"When someone shares your video, they are literally putting their name on it."
"End of the video likes are the deepest trust signal you can earn. Those viewers are the most likely to turn into a follower."
"We live in a save now, execute later society."
"Comments are a side effect and a byproduct of good content, not the goal."
"Stop getting emotional about your content. Just look at the data."
Things they pointed at.
How they asked for the click.
"You can sign up to do a ninety minute audit. The link is in the description below."
Brief and soft -- one sentence, then pivots to subscribe CTA and next-video card. Does not over-sell or repeat the pitch.
Word for word.
Instagram ranked its metrics so you would stop guessing.
The platform literally hands you a prioritized list of what it rewards -- and most people are optimizing for the metrics at the bottom while ignoring the ones at the top.
- Skip rate is the gate metric: if people are not watching past the first three seconds, none of the other engagement signals can accumulate.
- A skip rate of 30-40% is elite; under 30% is a potential viral signal. Above 50-60% means the hook needs work, not the algorithm.
- The first three seconds must include a strong visual hook, a strong verbal hook, and a clear confirmation of what the viewer will get -- all three, not just one.
- Share rate is the strongest social proof a Reel earns because sharing requires the viewer to associate their identity with the content.
- The three-prong shareability test: is it actionable today, does someone specific in their life need to hear this, will they look smart for forwarding it.
- Likes cluster at three distinct moments: the opening (hook strength), the middle (non-follower trust proof), and the end (deepest trust signal with highest follower conversion rate).
- Most creators design only for the hook and let the rest of the video coast. Engineering for all three like moments is what separates average and above-average like rates.
- Instagram deprioritizes saves because users almost never return to their saved folders -- saves are a bonus, not a primary optimization target.
- Comment-bait automations signal off-platform intent to Instagrams ranking system, suppressing reach even when they generate comment volume.
- Comments are a byproduct of good content, not a strategy. Engineer for skip rate and share rate first; comments follow.
- The retention chart benchmark is an average view duration of 20-30% of total video length. Use it to diagnose whether you have a hook problem, a middle problem, or a close problem.
- Do not judge a Reel in the first 24 hours. Some videos take a week or more to find their audience once the algorithm identifies who to distribute them to.